Storey drift
When analysing the effect of lateral loading on a multi-storey building due to seismic or wind loads, the storey shear and storey drift graphs tell a useful story. Storey drift is the lateral displacement of a floor relative to the floor below, and the storey drift ratio is the storey drift divided by the storey height. Seismic loading codes typically impose limits on storey drift as a percentage of the storey height and so the storey drift ratio is a useful quantity that can be directly compared with the code requirements. A storey drift ratio graph will show if particular floors are drifting more than others and highlight the fact that they may need stiffening.
You can obtain graphs showing the height-wise distribution of displacement, storey drift and storey drift ratio. These graphs are based on the lateral displacements of a representative node in each floor that is ideally placed close to the centre of geometry of the floor. You can select the representative nodes first or you can let SPACE GASS auto-detect the floor levels and choose the nodes closest to the centres of geometry. If diaphragms or wind loads have already been defined then the auto-detection will obtain the floor levels from the diaphragm or wind load levels.
If you want to control which nodes the storey drift graphs are based upon then you should select one node per floor, right-click and then select "Storey drift" from the popup menu that appears. Alternatively, if you want the nodes to be auto-detected then you should right-click without selecting anything before choosing "Storey Drift".
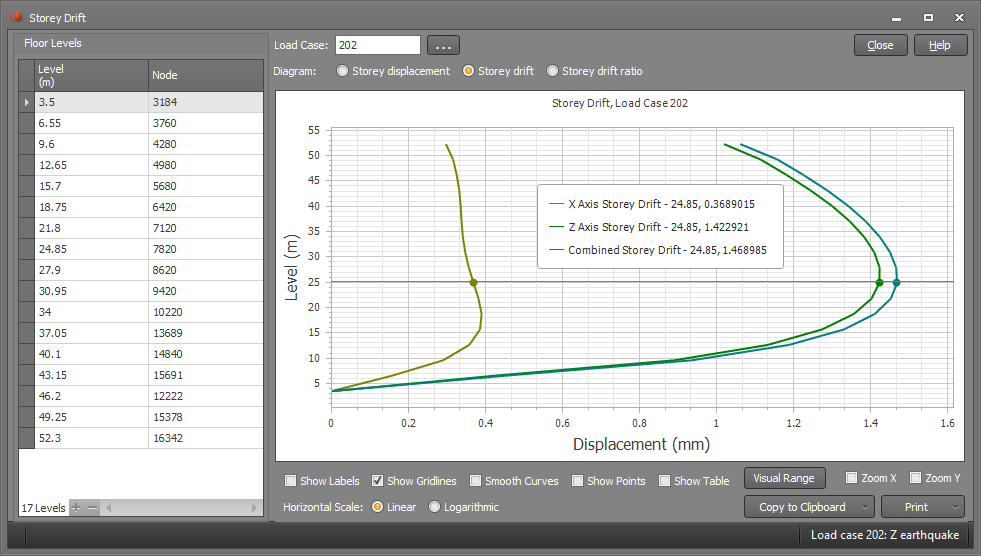
If you have elected auto-detection, and no diaphragms or wind loads have been defined then the floor auto-detection form will appear as follows. It looks for a minimum number of horizontal elements in a plane that would identify a floor. You can set a tolerance that allows for some variation in the height of the elements, plus you can control how many nodes within that tolerance are required to identify a floor level.
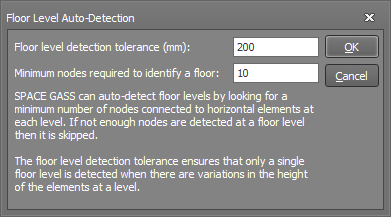
Once the floor nodes have been chosen and an analysed load case has been selected the storey displacement graph can be displayed as follows. If you hover over the graph you can see the tabulated values of each curve at the cursor location.
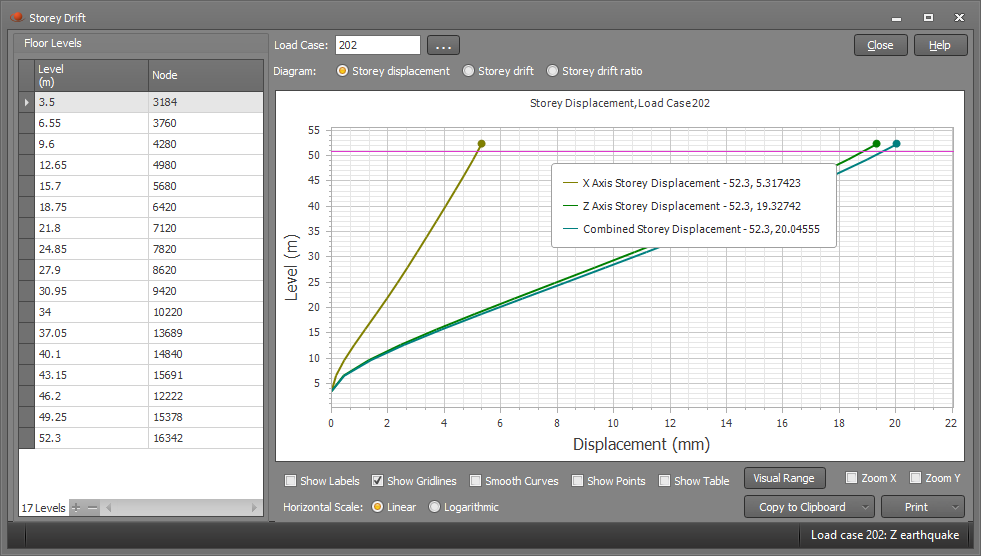
If you choose the storey drift graph then it appears as below. You can see that the Z axis drift (the displacement of a floor relative to the one below) for this load case is mostly in the range from 1.0 to 1.5 mm.
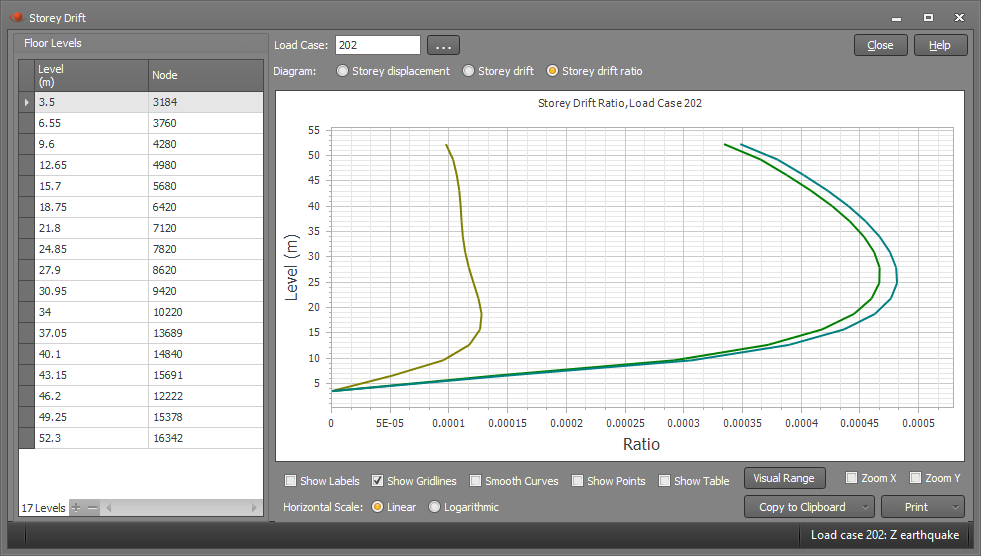
Finally, the storey drift ratio graph shows how the storey drift compares to the storey height.